
Why Choose Inorganic Minerals for Global Sourcing? The answer begins with performance, consistency, and measurable supply requirements. Inorganic Minerals support manufacturing across ceramics, construction, agriculture, coatings, glass, and advanced materials. Their chemical stability can improve product durability and processing control. However, material quality depends on more than a supplier’s product name.
Experienced sourcing teams examine assay results, particle size, moisture, color, and impurity levels. They also request representative samples before approving commercial volumes. A reliable supplier should provide batch traceability, safety documentation, and clear export records. Independent laboratory testing can verify technical claims. It can also expose differences between samples and delivered cargo.
Small details matter. A sealed 25-kilogram bag should match its specification. A bulk shipment should arrive with consistent loading records. Port conditions, packaging strength, and storage humidity can affect final performance. Regional regulations may also require specific documentation, labeling, or chemical registration. Professional buyers review these requirements before signing contracts.
Inorganic Minerals are not automatically the best choice. Mining impacts land, energy use, water consumption, and local communities. Global sourcing also adds freight emissions and currency risks. These concerns deserve practical review, not optimistic slogans. Suppliers with responsible extraction practices, transparent audits, and realistic lead times offer stronger long-term value. Still, documentation is never a substitute for verification. A thoughtful sourcing program compares quality, cost, origin, risk, and environmental performance together. This balanced approach helps companies build resilient supply chains without overlooking uncomfortable weaknesses.
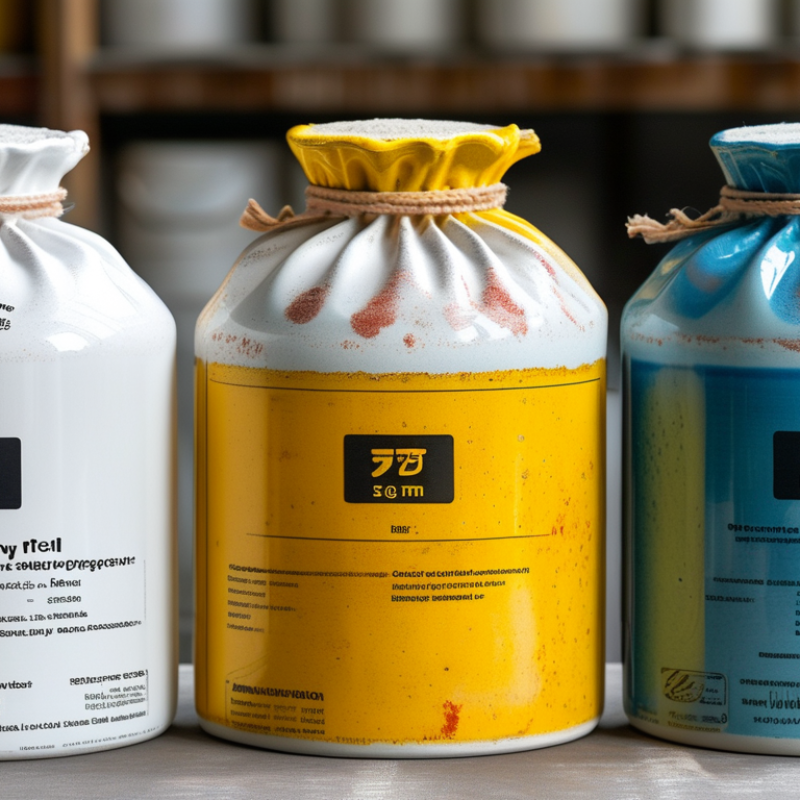
Inorganic minerals are naturally formed materials without biological origins. They include limestone, silica, gypsum, clay, phosphate rock, and salt. Their properties come from crystal structure, purity, hardness, and heat resistance. The boundary is not always tidy. Processing can also change mineral performance.
Their uses are wide and highly practical. Limestone and clay support cement production and construction materials. Silica enters glass, foundry molds, filtration media, and industrial ceramics. Gypsum helps produce wallboard and construction plaster. Phosphate rock supports fertilizer manufacturing. The USGS Mineral Commodity Summaries 2024 estimated global phosphate rock production at about 220 million metric tons in 2023. It also reported global salt production near 270 million metric tons.
These figures show strong industrial demand. They also reveal sourcing pressure. A mineral’s value depends on more than volume. Moisture, particle size, impurities, transport distance, and processing consistency matter. A cheaper deposit may create higher costs later. This is where experience becomes important. Laboratory testing, mine documentation, and shipment inspections reduce uncertainty, although they cannot remove every risk.

Inorganic minerals are often selected for global sourcing because their composition is clear and measurable. They include mineral salts, oxides, and other non-carbon-based compounds. Organic alternatives may bind minerals to amino acids, proteins, or other carbon-based molecules. This difference can affect absorption, stability, cost, and handling. Neither category is automatically better. The right choice depends on the intended use, dosage, diet, and evidence behind the specific form.
Inorganic forms usually offer predictable assay results and strong storage stability. They can also simplify large-volume purchasing across different regions. Organic forms may provide improved tolerance or absorption in some applications, but results vary between compounds. A practical comparison should examine bioavailability studies, solubility data, contaminant testing, and batch consistency. The comparison is not perfectly neat. Marketing claims can sound stronger than the available evidence.
Tips: Ask suppliers for a current specification sheet, certificate of analysis, origin details, and independent test results. Check heavy metals, moisture, particle size, and stability data. Compare delivered cost, not only the quoted mineral price. Small details matter. Also, review local import and labeling requirements before shipment. An organic form may appear technically superior, yet its higher cost or shorter shelf life can weaken the sourcing decision. An inorganic form may be economical and reliable, but poor solubility could limit its practical value. That trade-off deserves a documented review.
Inorganic minerals support global supply chains because their physical and chemical properties remain measurable across shipments. Buyers can define purity, particle size, moisture, hardness, color, and bulk density before production begins. These details matter when materials travel from a mine to a distant processing plant. Small variations can affect mixing, filtration, coating, or kiln performance. That predictability supports planning.
In practice, reliable sourcing depends on more than a laboratory certificate. Procurement teams should compare representative samples, review test methods, and inspect packaging before approving regular volumes. A sealed bag, stable pallet, and clear lot number can prevent confusion after weeks at sea. Moisture control is especially important for fine powders, which may cake in humid conditions. Traceability matters too. Records should connect the extraction site, processing batch, test results, and shipping documents. Independent testing can confirm critical properties when a new supplier or deposit enters the chain.
Yet mineral supply is not perfectly uniform. Geology changes, equipment ages, and sampling may miss a narrow quality shift. A specification can look complete and remain too broad. Responsible buyers leave tolerance ranges, retesting rules, and corrective actions in writing. Environmental and labor due diligence also strengthens supplier credibility, even when the material itself is ordinary. Regional alternatives reduce disruption, but they may require fresh qualification. That extra work is easy to underestimate. Still, measurable properties make inorganic minerals practical to evaluate, compare, and move through complex international networks.
Why Choose Inorganic Minerals for Global Sourcing?
Quality begins before loading. Inorganic minerals can vary by deposit, season, and processing method. Buyers should verify assay results, moisture, particle size, and trace impurities. A bright powder is not automatically a consistent material. The United States Geological Survey estimated global lithium mine production at about 180,000 metric tons in 2023, measured as lithium content. That growth shows stronger supply, but not equal quality. Sampling must represent the full shipment, not only the top layer of a bag. Small differences can affect filtration, conductivity, color, or production yield. Laboratory testing matters.
Availability also depends on geography and processing capacity. The International Energy Agency reported that the top three refining countries held about 86% of global capacity for key energy minerals in 2023, rising from 82% in 2020. Concentration creates exposure to port delays, energy shortages, export controls, and sudden freight changes. It is easy to underestimate this risk. A nearby mine may still lack reliable purification or packaging. Sourcing teams should compare production records, reserve information, inspection systems, and backup routes. Costs include more than the quoted mineral price. Energy-intensive drying, impurity removal, inland transport, ocean freight, insurance, testing, and storage can change the delivered cost significantly. I have seen “low-cost” offers become expensive after moisture corrections and rejected batches. Contracts should define acceptance limits clearly, although specifications are sometimes too rigid for real-world deposits.
A comparative sourcing guide covering composition, quality indicators, global availability, logistics, and indicative bulk pricing.
| Mineral | Typical Chemical Composition | Key Quality Indicators | Typical Mohs Hardness | Global Availability | Indicative Bulk Price Range (USD/metric ton) |
Main Cost Drivers | Typical Applications |
|---|---|---|---|---|---|---|---|
| Limestone | Calcium carbonate (CaCO3), commonly 90–99% in industrial grades | CaCO3 content, MgO, SiO2, whiteness, moisture, particle size | Approximately 3 | Very high; widely distributed in sedimentary rock formations | 10–60 | Quarry distance, crushing and grinding, whiteness, purity, packaging, inland freight | Cement, construction materials, agriculture, glass, fillers, water treatment |
| Dolomite | Calcium magnesium carbonate, CaMg(CO3)2, often 90–99% in selected grades | CaO/MgO ratio, Fe2O3, SiO2, loss on ignition, particle size | Approximately 3.5–4 | High; commercially available across many regions | 15–70 | Purity, calcination requirements, particle size, energy use, transport distance | Refractories, steelmaking, glass, aggregates, soil conditioning |
| Kaolin | Kaolinite, Al2Si2O5(OH)4, usually processed to improve brightness and fineness | Brightness, whiteness, particle-size distribution, viscosity, Fe2O3, TiO2, moisture | Approximately 2–2.5 | High, although premium bright grades are geographically concentrated | 40–180; specialty grades may exceed 200 | Beneficiation, brightness, ultrafine grinding, drying, coating, port access | Ceramics, paper coating, paints, plastics, rubber, engineered products |
| Bentonite | Smectite-rich clay, commonly containing 60–85% montmorillonite in commercial grades | Swelling index, fluid loss, gel strength, cation-exchange capacity, moisture, grit content | Approximately 1–2 | High but uneven; deposit chemistry strongly affects performance | 40–180 | Activation, drying, milling, swelling performance, moisture control, transport | Foundry sand, drilling fluids, cat litter, civil engineering, absorbents |
| Silica Sand | Silicon dioxide (SiO2), approximately 95–99.9% depending on grade | SiO2 purity, Fe2O3, grain size, shape, turbidity, moisture, acid solubility | Approximately 7 | Very high for common grades; high-purity deposits are more limited | 15–80; high-purity grades may exceed 100 | Washing, sizing, magnetic separation, purity, drying, bulk density, freight | Glass, foundry, construction, filtration, ceramics, silicon-related processing |
| Barite | Barium sulfate (BaSO4), commonly 85–95% in commercial concentrates | Specific gravity, BaSO4 content, particle size, soluble alkaline-earth metals, moisture | Approximately 3–3.5 | Moderate to high; quality deposits and processing capacity vary by region | 60–220 | Specific gravity, beneficiation, grinding, drilling-grade standards, ocean freight | Oil and gas drilling fluids, coatings, plastics, radiation shielding, chemicals |
| Gypsum | Calcium sulfate dihydrate, CaSO4·2H2O, commonly 80–98% in natural material | Purity, crystal structure, moisture, setting time, whiteness, chloride and organic content | Approximately 2 | High; natural deposits and synthetic sources are available in many markets | 10–50 | Calcination, purity, energy costs, moisture, product form, local construction demand | Plasterboard, cement set control, plaster, agriculture, molds and casts |
| Talc | Hydrated magnesium silicate, Mg3Si4O10(OH)2, often 90–99% in processed grades | Purity, whiteness, lamellarity, particle size, asbestos-free verification, oil absorption | Approximately 1 | Moderate; premium grades depend on deposit mineralogy and processing | 80–350 | Micronization, whiteness, mineral purity, testing, packaging, long-distance freight | Plastics, ceramics, paints, paper, rubber, cosmetics and personal-care products |
Sourcing Notes
Why Choose Inorganic Minerals for Global Sourcing?
Global sourcing of inorganic minerals requires more than comparing prices. Buyers should evaluate each supplier’s technical capability, production stability, and documentation practices. Request recent certificates of analysis, safety data, batch records, and origin details. Compare test methods, not only reported values. A calcium carbonate result may look acceptable, but different particle-size methods can produce misleading comparisons.
Supplier visits can reveal useful details. Check storage conditions, moisture control, labeling, laboratory equipment, and batch segregation. Ask how the supplier handles rejected material and unexpected contamination. Independent testing of pre-shipment samples adds confidence. It also exposes weaknesses before a full container arrives. Still, one audit cannot prove permanent performance. That limitation deserves honest attention.
Tips: Use a risk-based supplier scorecard. Review quality consistency, lead times, payment terms, transport routes, and regulatory documentation. Keep an approved backup supplier for critical minerals. Define acceptance limits and corrective-action deadlines in writing. Monitor every shipment, even after a supplier earns approval. Small deviations can become expensive when production schedules are tight. Expect occasional communication gaps across time zones, and record decisions clearly.
The chart presents the European Union’s 2030 Critical Raw Materials Act benchmarks: at least 10% of annual consumption from extraction within the EU, 40% from EU processing, and 25% from recycling. It also sets a 65% ceiling for dependence on any single non-EU country for each strategic raw material. Buyers can use these benchmarks to assess supplier geographic diversity, processing capacity, recycling capability, and concentration risk when sourcing inorganic minerals.